Packet captures are a way of dumping your device's network traffic for engineer review. If you've been asked to provide us with a packet capture, don't despair ... we're only expecting you to collect it, you don't have to do any of the analysis part!
Collecting a packet capture from a Windows or Linux server are explained below. Our technicians may also request a packet capture from your firewall or ATA/analog gateway. The methods of taking a packet capture from firewalls varies from device to device; we recommend contacting your network engineer for assistance. For ATAs and analog gateways, most require some form of "network tap" as described in Wireshark's Capture Setup Guide. Most of our customers opt to set up a port mirror on their switch, but not all switches support this.
There are only a few embedded FoIP devices that don't require a network tap:
- Polycom: It is possible to take a packet capture on Obihai devices if they're paired with the ObiTALK cloud platform. If you have an Obihai device but don't use ObiTALK, let our support team know.
- Toshiba: Toshiba MFPs that support T.38 natively are able to take packet captures of their own traffic. Contact Toshiba support for assistance.
- Grandstream: Grandstream UCMs are an embedded PBX solution. They allow you to take packet captures through the web interface.
When escalating to us, always zip the captures before sending them. You can escalate packet captures up to 7MB in size as an email attachment or up to 50MB as an upload to our support portal. If the capture is larger, please send a link to a file-hosting service of your choice.
1. Installing Packet Capture Software
Windows
Install Wireshark on your Microsoft Windows machine. The latest Wireshark version can be found at https://www.wireshark.org/#download. This installer may also be run to upgrade Wireshark.
Linux
Although it is also possible to install Wireshark on Linux, this guide will use the most common Linux command for taking packet captures from command line, tcpdump. tcpdump is not installed by default on most Linux distributions, but it is a standard package in most repos.
2. Live Call Captures
If you or your customer are readily able to reproduce the issue, your best bet is to start the capture right before reproducing the issue and ending it shortly after. Make sure to wait a few extra seconds after the call ends to ensure all traffic related to the call has ceased.
Windows
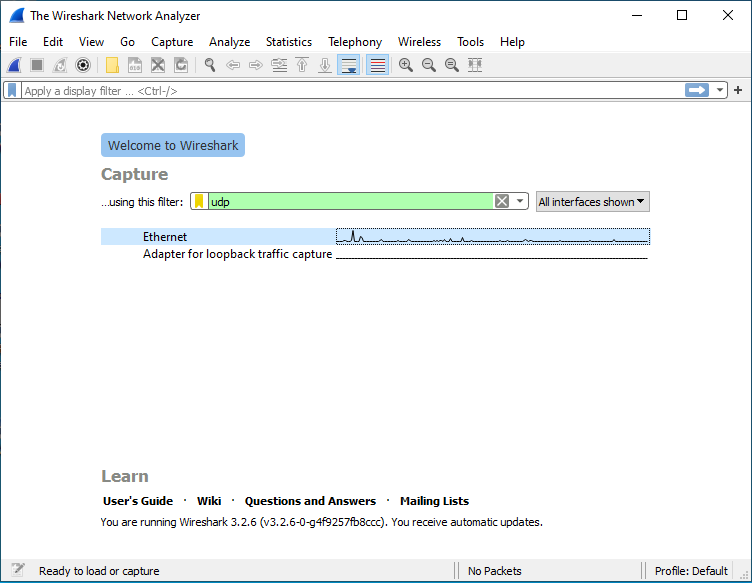
After opening Wireshark, make sure the interface you want to capture on is highlighted in blue and that your filter is set to "udp" and is highlighted in green. Once you're ready to start the capture, click the blue shark fin in the menu bar.
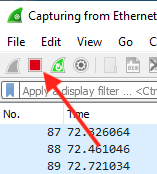
Once you've captured everything you want to capture, click the red stop icon in the menu bar. The capture must be stopped before you can save it.
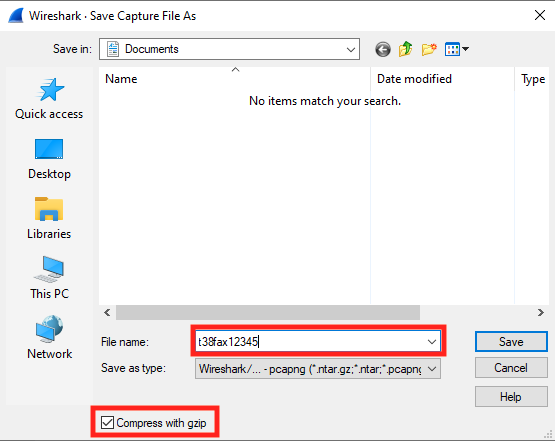
To save the file, from the menu bar select File > Save. A window will pop up prompting you to select the desired save location. Navigate into the folder that you'd like to contain the packet capture. Check "Compress with gzip" at the bottom of the window and then enter your filename. We recommend "t38fax" + your T38Fax ticket number: in this example, we pretended our case number was 12345. The filename should not contain a file extension. To write the capture to disk, hit Save.
Linux
As the root user, enter the following command:
# tcpdump -i any -w filename.pcap udp
Using -i any causes tcpdump to capture on all interfaces. If you only want to capture on one interface, you can use the network interface here instead. You can discover the name of your network interfaces using the ip addr command. It is also possible to use any in place of an interface name to capture on all interfaces. Place your test call, and then hit CTRL-C from the command line to exit the capture. Before uploading the file, please make sure to compress it.
$ gzip -9 filename.pcap
The filename will be appended with the .gz extension: in our example case, this will be filename.pcap.gz.
3. Using Ring Buffers For Capturing Intermittent Issues
Setting up a ring buffer for packet captures allow you to continuously capture packets to a file without having to worry about your hard drive filling up. This can be helpful if you have an intermittent issue . The ring buffer works by filling up one file at a time to a maximum size, then creating another file until the maximum number of files have been created. Once both the conditions that all files have reached their maximum size and the maximum number of files has been reached, Wireshark loops back around to the first file created, wipes it and begins writing new content it. This means the capture effectively gives you a backlog of the last * bytes of network traffic on-disk, and never more than that. Our example here uses 10 files, each 400MB in size: this will take up 4GB of drive space. If you have 4GB of spare drive space on your server, we recommend using the example values presented here.
It is possible to tweak these values if you need to, but keep in mind that since Wireshark wipes the file it moves on to before beginning to write again, it's best to have many small files as opposed to a few large files to retain the most data at any one time. Once the ring buffer has reached its full capacity, the total amount of data stored on disk at any one time will fluctuate between * and ( - 1) * . In our example, that means we will have between 4GB and 3.6GB of data stored on disk at any one time. A ring buffer containing just a couple of files, therefore, is not very useful, as the amount of backlog you have at any one time varies dramatically.
Once you start the capture, you don't need to stop it until you're certain it's no longer necessary to capture any more calls. If you need to "snapshot" the files to escalate them, you can simply copy of them out of the folder, assuming you have space. When escalating to us, always zip the captures before sending them. You can escalate packet captures up to 5MB in size as an email attachment. If the capture is larger, please either send a link or request a remote session for the files to be copied over from your computer.
Windows
Open Wireshark and select the black and white gear icon in the menu bar.
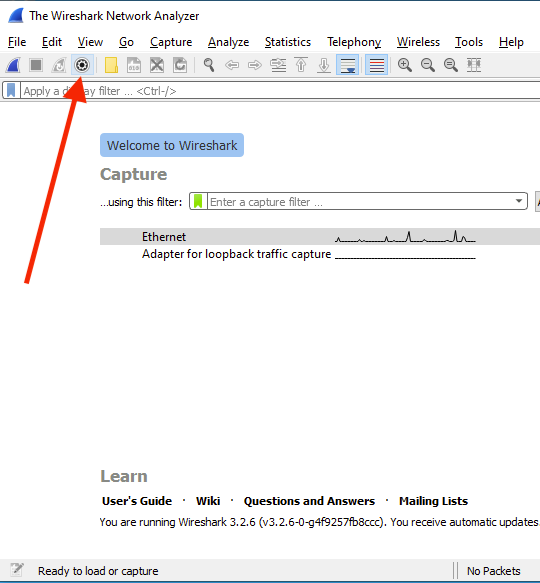
The Capture Interfaces window will open, containing a number of tabs. The first tab is the Input tab. From this view, highlight the interface you want to capture and type in "udp" for your capture filter.
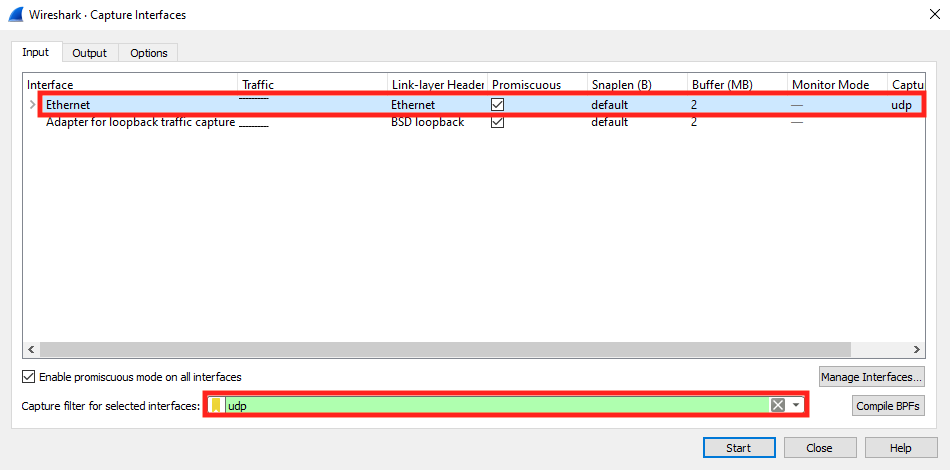
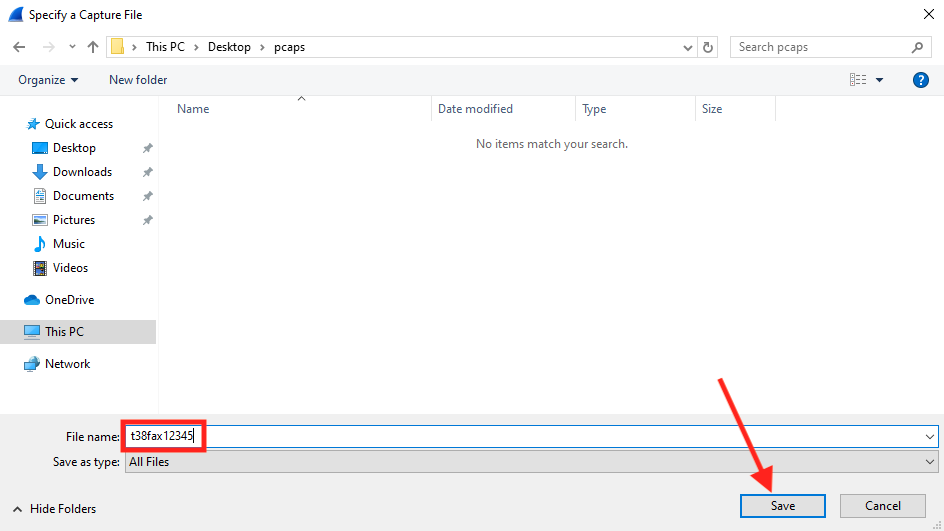
Click on the Output tab, then the "Browse..." button on this view. Open the folder where you'd like to save the captures. In the "File name: " text field, enter a string you'd like prepended to your capture. We recommend "t38fax" + your T38Fax ticket number. We pretended this was for ticket #12345 here. Do not put an extension in this section. Hit "Save" when you're satisfied.
In the "File" field, you should now see the correct file location plus filename prepend string. Check "Create a new file automatically..." to make the fields below it configurable. From those fields, check and configure "after [400] [megabytes]" as well as "Use a ring buffer with [10] files" - make sure all other fields are unchecked.
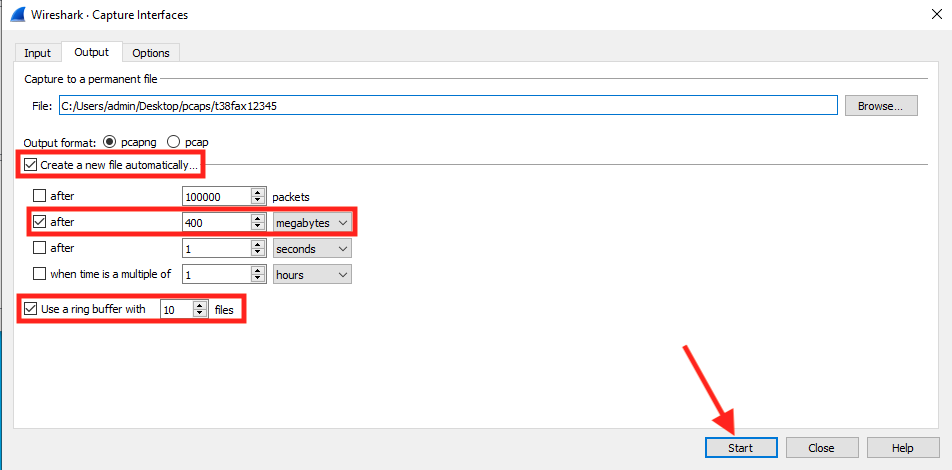
Once you're satisfied with your settings, hit "Start" to begin the packet capture.
Linux
The following command will initiate a ring buffer capture, and must be run as root.
# tcpdump -i any -W 10 -C 400 -w t38fax12345_ udp &
-iSelect the interface. Usinganycauses tcpdump to capture on all interfaces. If you only want to capture on one interface, you can use the interface name that shows up when you runip addr.-W: The number of files to use in the ring buffer.-C: The size of each file in the ring buffer.-w: Use this as the file prepend string.udp: Only capture UDP traffic
The & symbol puts the process in the background. Once you're done capturing, you'll need to run the following command as root to stop tcpdump:
# pkill tcpdump
The generated files will appear as t38fax12345_0, t38fax12345_1, t38fax12345_2 ... t38fax12345_9. You can compress these files using the following command, again replacing "12345" with your ticket number:
$ gzip -9 t38fax12345_*
Comments
0 comments
Please sign in to leave a comment.